LOG-a-TEC
Online Short-term Forecasting of Photovoltaic Energy Production
About
Short-term forecasting of the energy production is one of the key issues in smart homes that try to achieve efficient balance among the energy production, storage and consumption. These type of predictions also benefit the power supply companies in order to better prepare their systems for otherwise unpredictable production patterns. In a few years, as more and more PV cells are added to the power grid, these problems will only grow larger and good prediction systems will be essential. In this project, we predict how much power will be generated on the PV cells of one building 6 hours in the future. The main challenges with such small scale predictions is 1) the reliance on local weather conditions and 2) reliance on the quality of the measurements performed on the solar panels. These challenges are solved by using our own hardware, state of the art local weather prediction and open source prediction software, that can tie all of this together.
The application allows monitoring of actual and predicted PV production by the power supply companies, and provides end-users with a dashboard where they can also monitor and manage their system. The current state of the application is a proof-of-concept demo.
Technology
Hardware & Production data
In collaboration with Telekom Slovenije, we used the VESNA platform as a baseline for the development and implementation of a sensor network for detailed real time monitoring of operating parameters in a photovoltaic system.
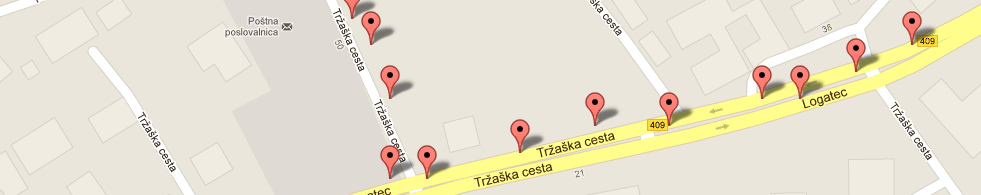
The setup consists of four clusters of panels, as depicted in the figure below: two clusters having their panels oriented towards the south, one cluster having its panels oriented towards the east and the last cluster having its panels oriented towards the west. Between each cluster of panels and the corresponding power inverter, a VESNA sensor node is installed and measures (i) the produced current [A] of one solar panel within cluster and (ii) the temperature of the PN junctions (modeled with the top and bottom solar panel temperature measurement) [°C]. The communication between nodes is based on ZigBee at 868 MHz, while the backhaul connection to the remote server is implemented via the mobile network (3G). The measurements are performed every 2 minutes and then sent to a server. THe Sensor measurement data and associated metadata are collected in a database, and is accessible via a web user interface or directly via HTTP REST interface.
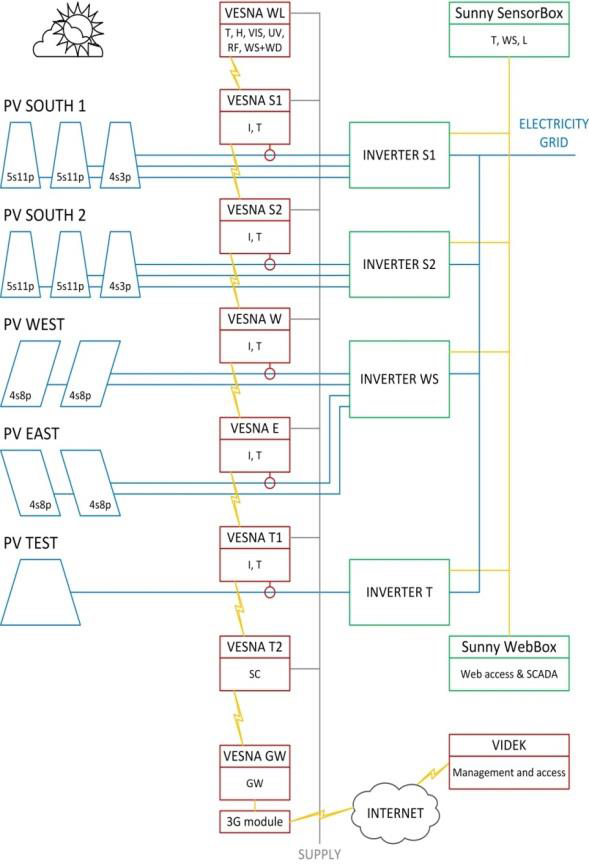
The deployed sensor nodes also incorporate sensors for monitoring weather conditions (air temperature, relative humidity, wind strength and direction, precipitation), the intensity of solar radiation in the visible and ultraviolet region of the spectrum.
Weather prediction
Weather predictions were created using a Numerical Weather Prediction model ALADIN, and were provided by the Slovenian Environmental Agency. They consisted of two 54 hour forecasts per day, each every twelve hours, and included multiple types of weather information, among the most useful were the predicted solar radiation, temperature and cloud coverage. Another crucial component for good prediction are also the sun angles at a specific time in the future (6 hours ahead in this case), for a given location. These are relatively simple to calculate and for improving prediction we used the calculated sun elevation and azimuth at the specified time and place.
PV energy prediction platform
The implementation of the system used for online forecasting of the PV current production is based on the open-source QMiner tool that acts as a server, database, and also features online Artificial Neural Networks that are used for prediction. The functional blocks comprising the system are depicted here:
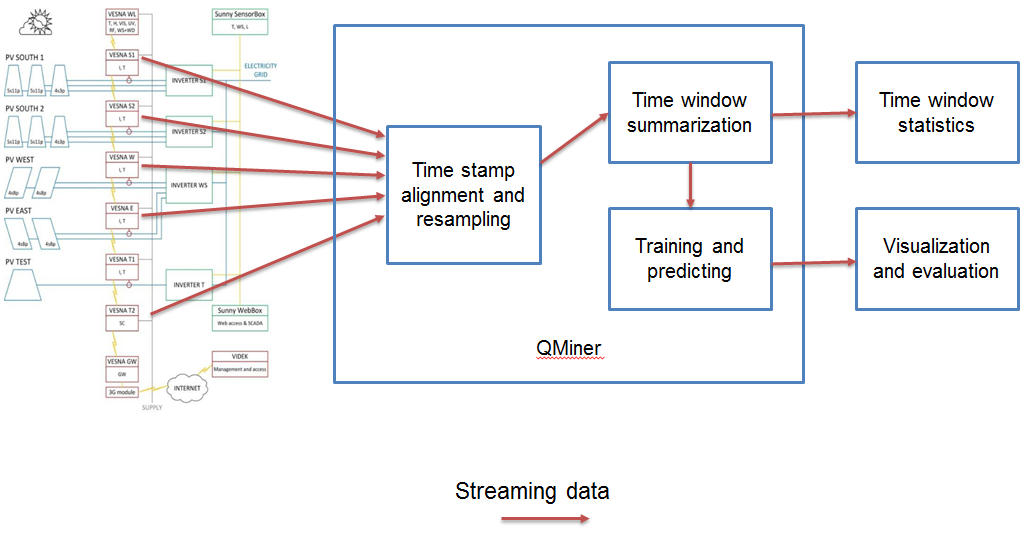
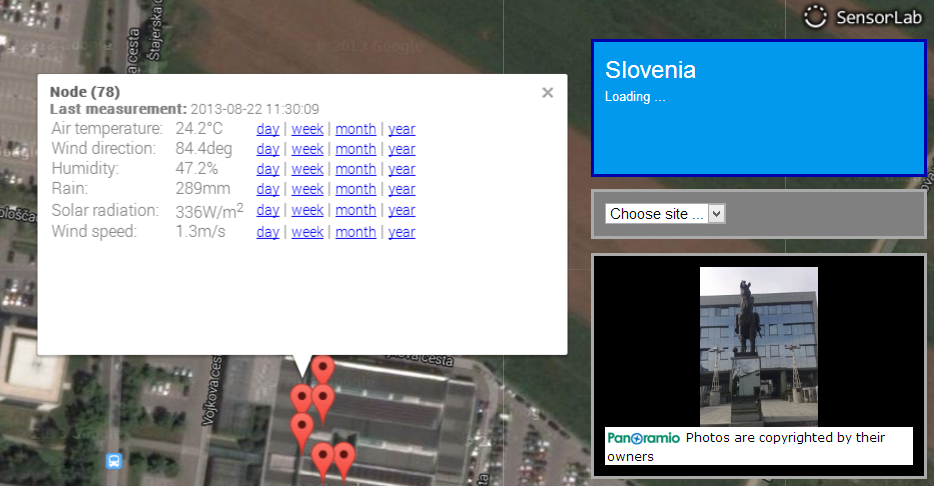
The locally measured data points are being streamed every two minutes to the time stamp alignment and resampling block that sends them to a time window summarization block which makes a summary for each hour. The summarized data points are then sent to the training and prediction block from where they can be visualized using a web-based interface shown below.
Implementation
As described above the system uses real data and uses Online ANN for prediction. This means the system is ready for consumer use as soon as some new data sources are plugged in. The usage of Online ANN means that the model of the system which is used for prediction gets updated a little after each new data point. So with each new piece of data the neural network model is a little closer to perfection and this also means that the model can change and adapt if there are some changes in the real system. For example deterioration of solar cell efficiency, dirt or leaves on some of the cells, etc.
Demo
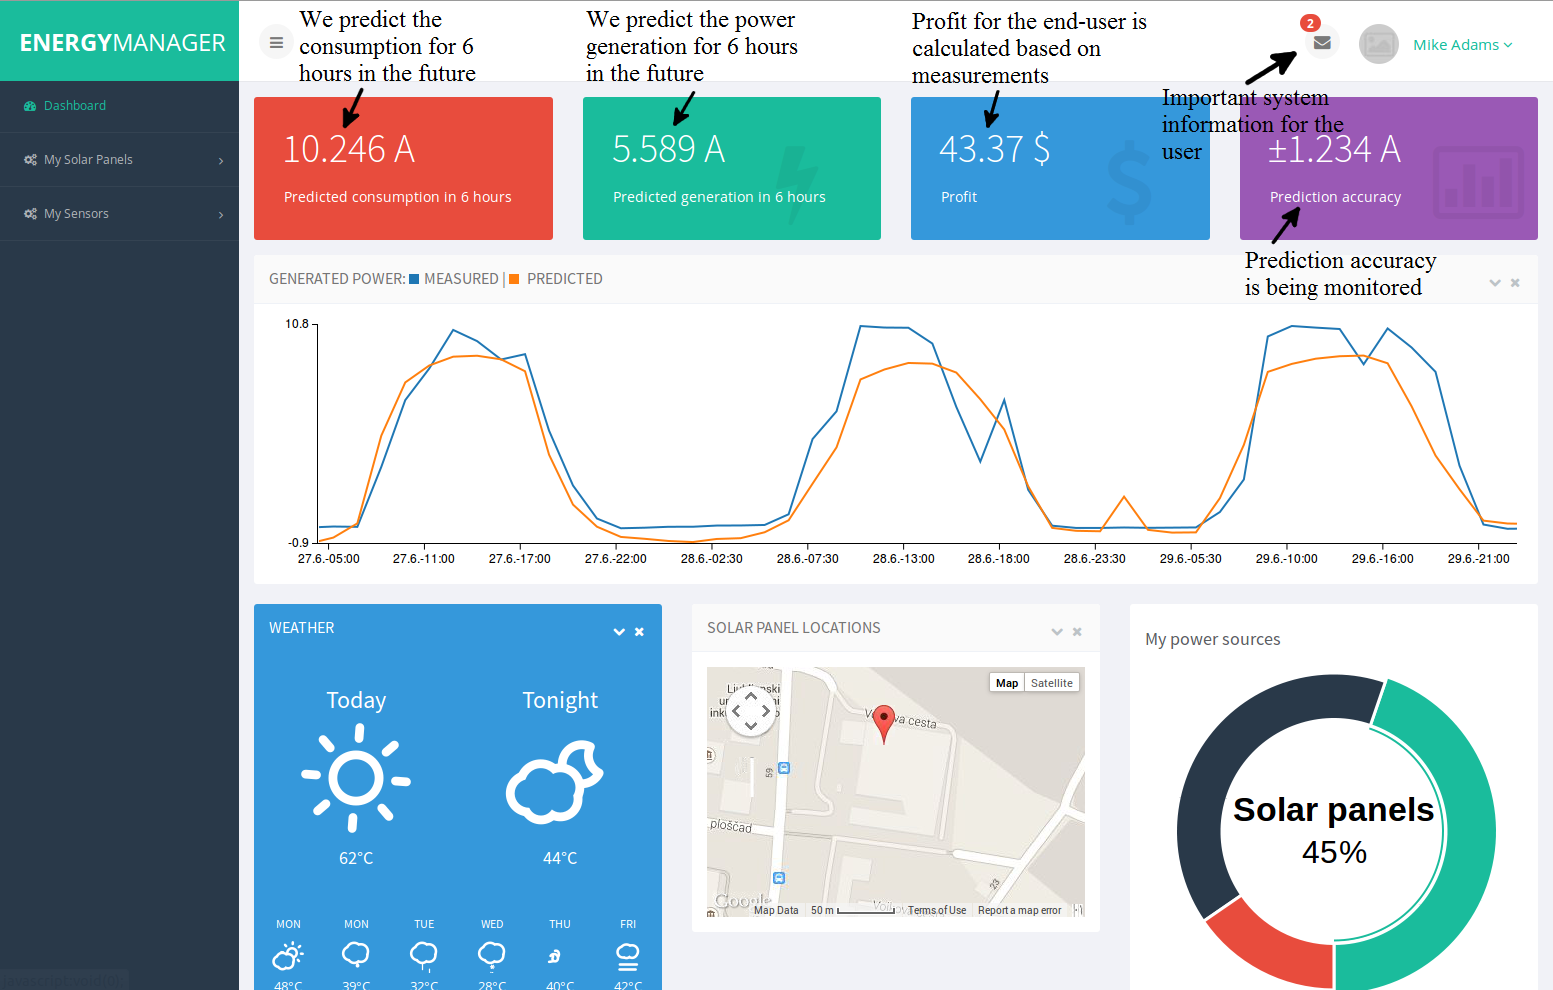
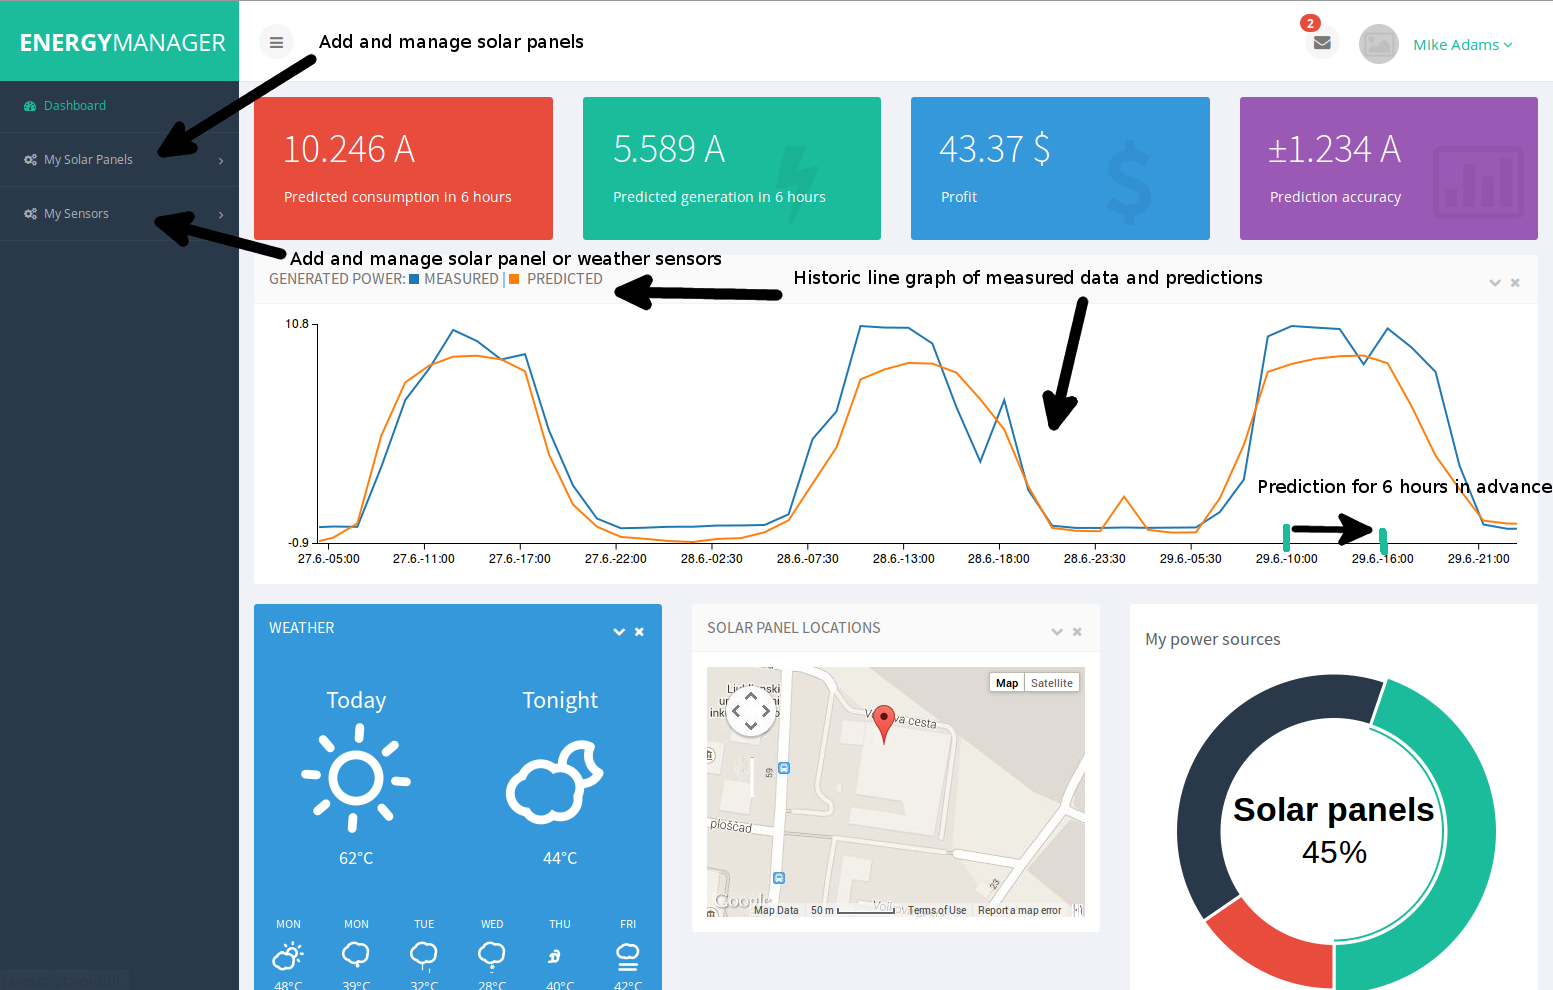
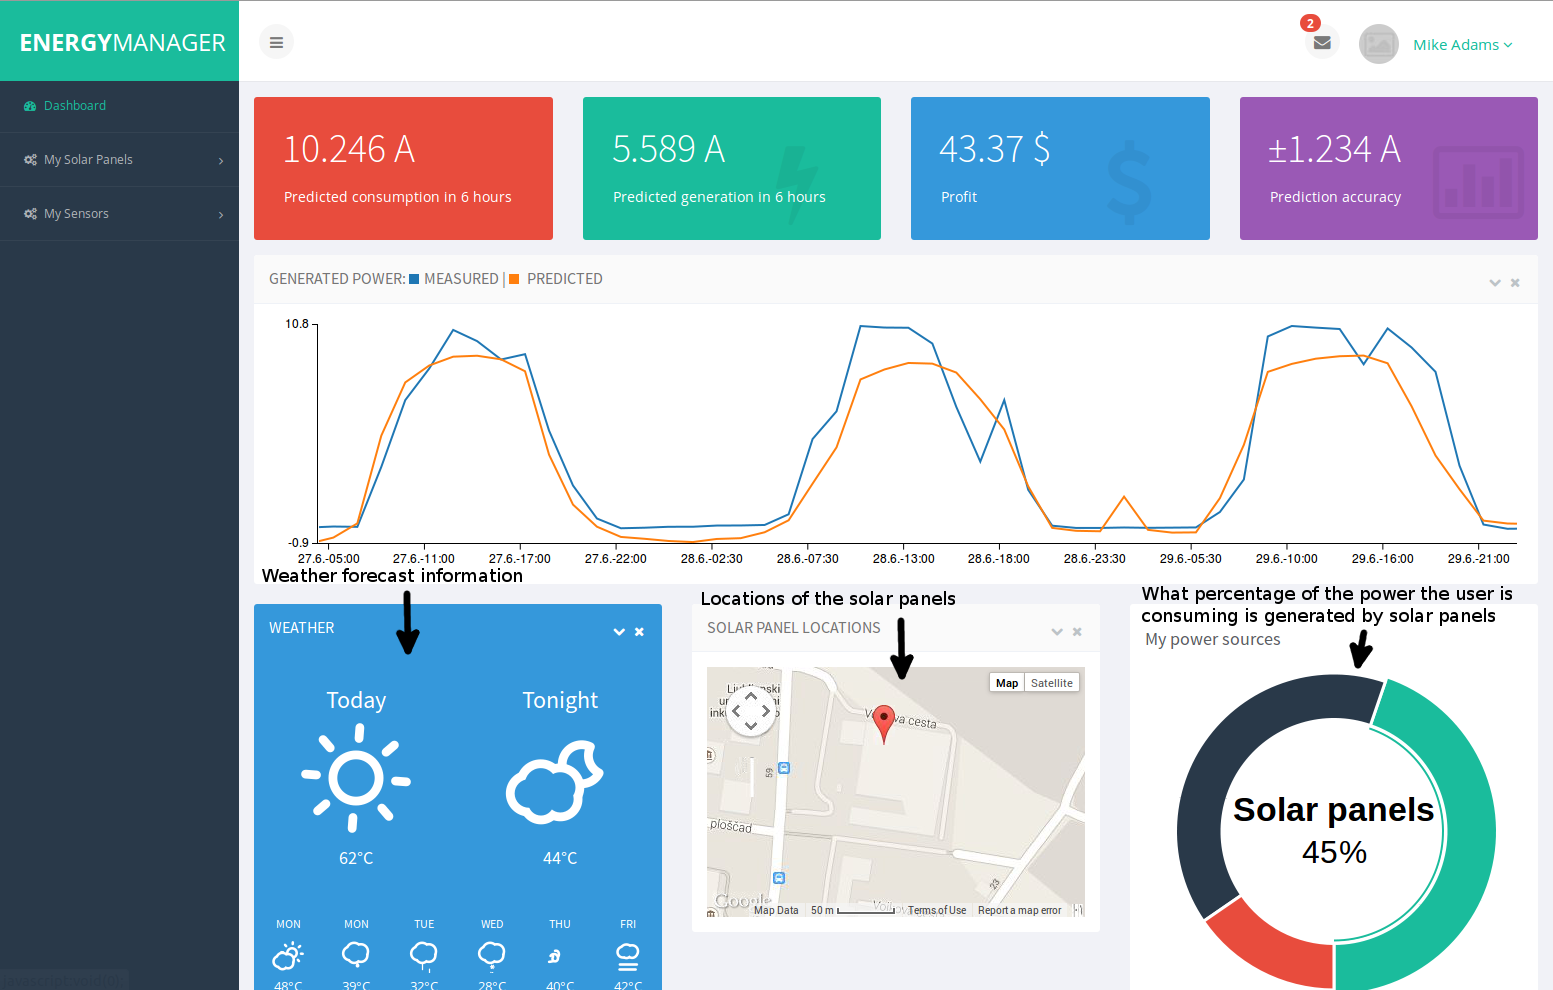
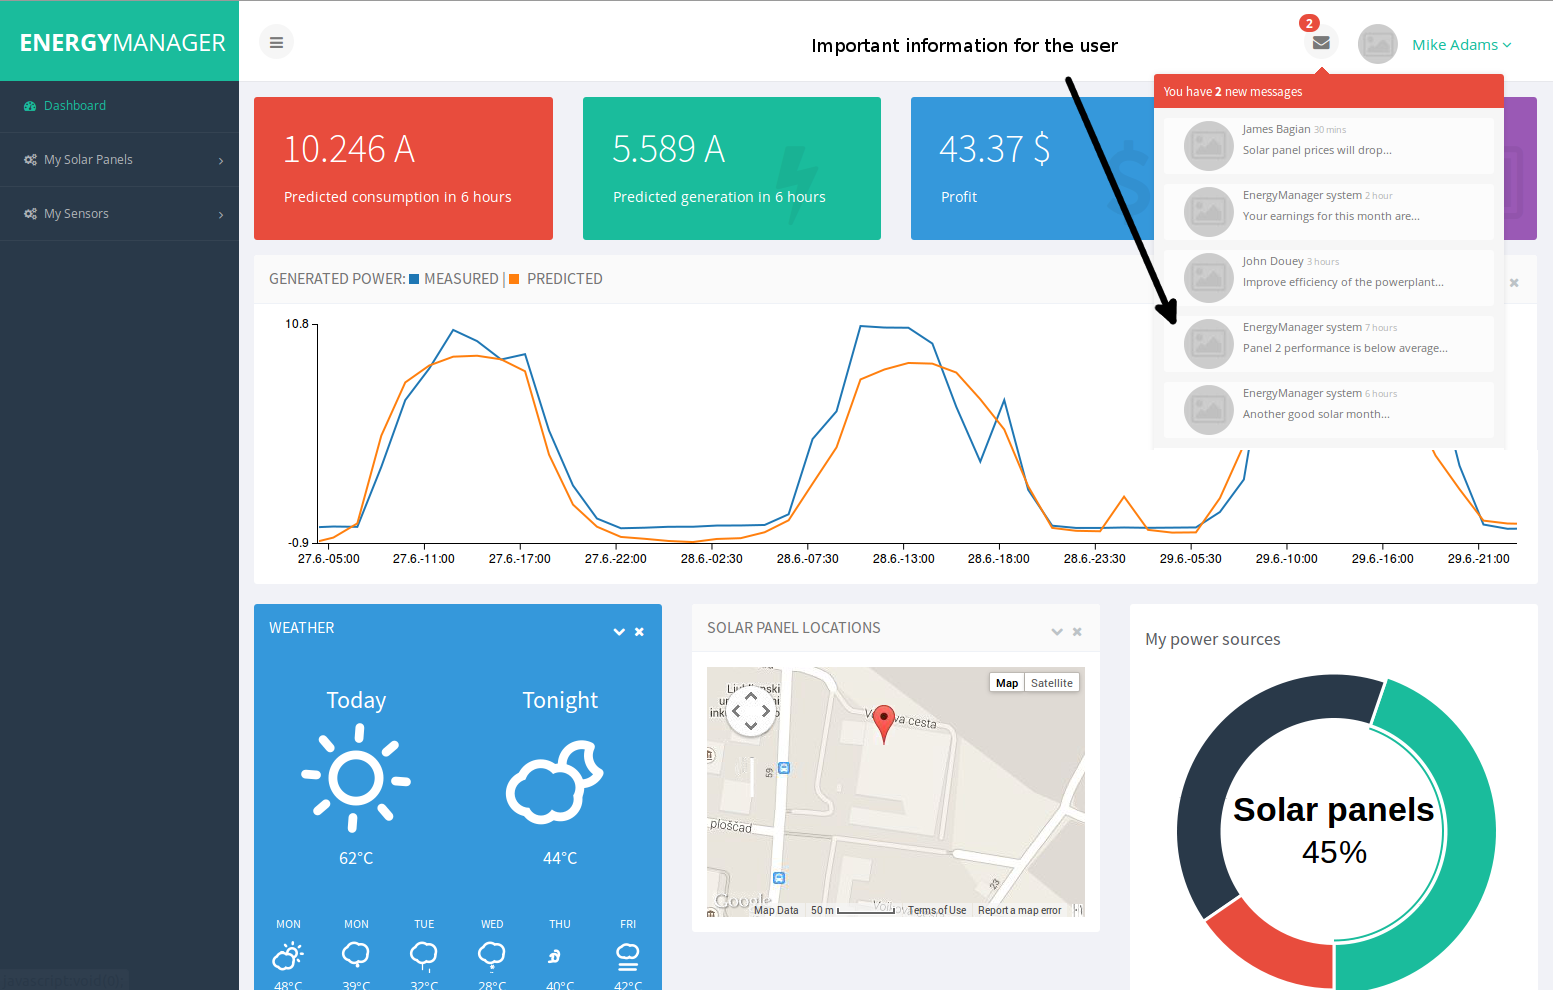
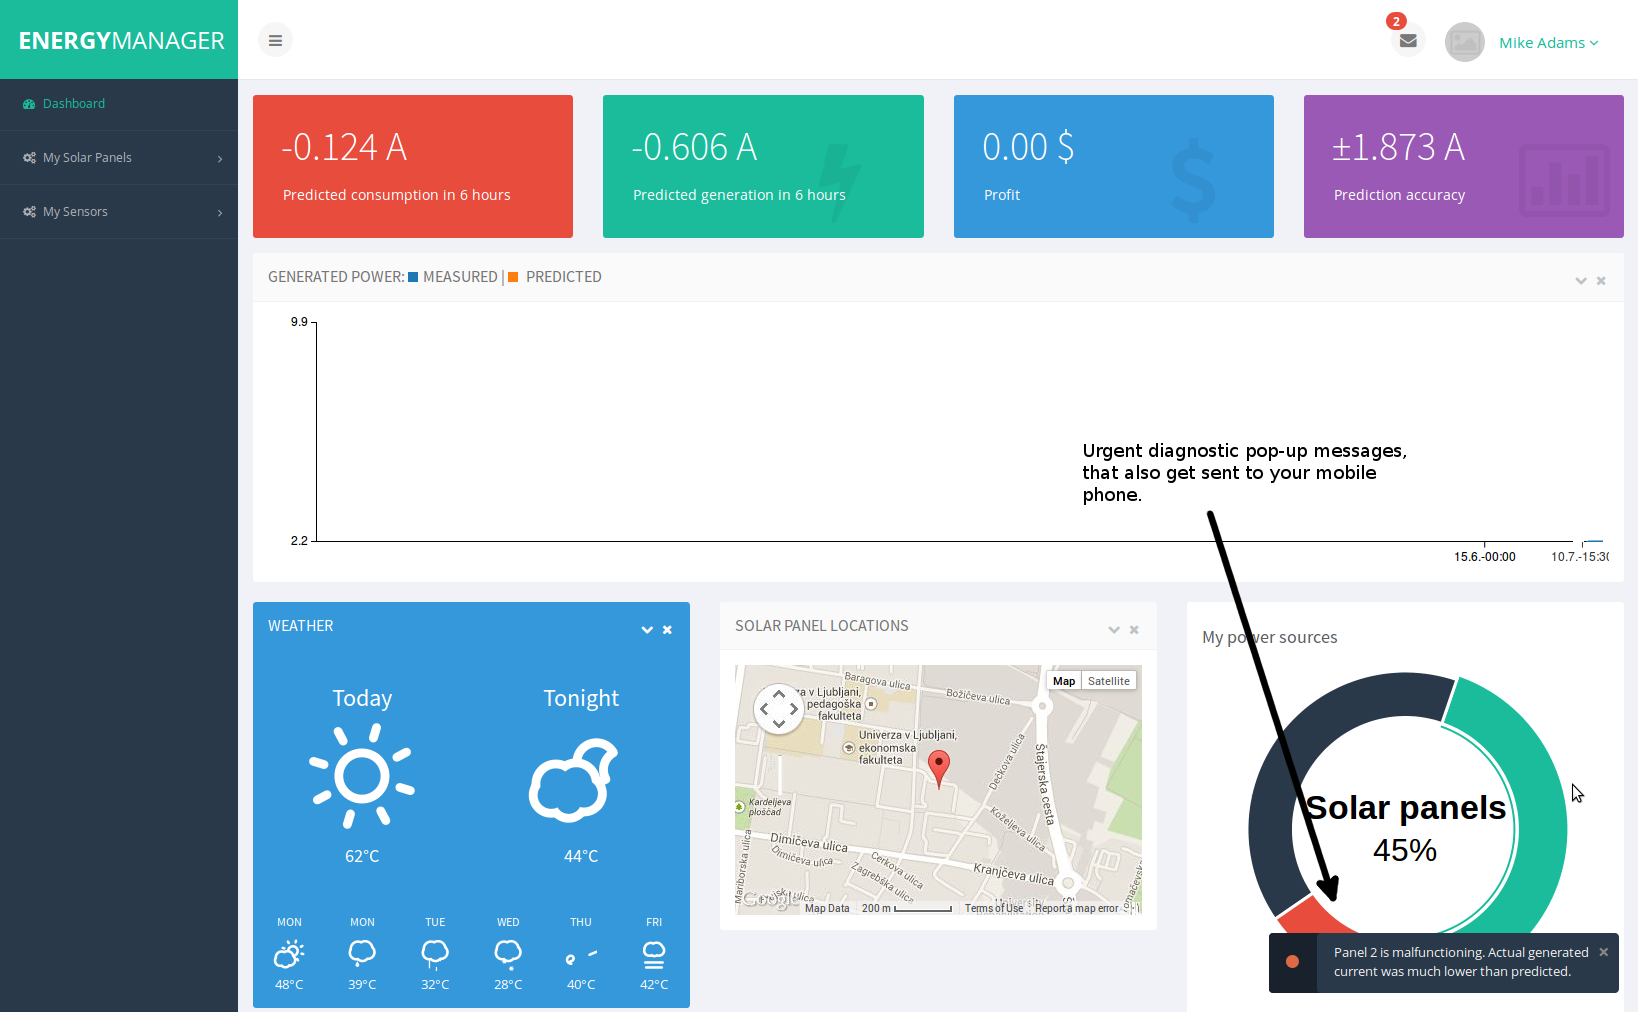
The demo is designed as a complete home power management system, and includes a dashboard for a very clear and easy presentation of the data. The proposed features of the system are presented in the following images. The demo is currently just a proof of concept, and is available here.
Related paper
More details are available in the following scientific publication: Aleksandra Rashkovska, Jošt Novljan, Miha Smolnikar, Mihael Mohorčič, Carolina Fortuna; Online Short-term Forecasting of Photovoltaic Energy Production, 2015 IEEE PES Innovative Smart Grid Technologies Conference; 18-20 Feb. 2015; Washington DC, USA.